On Monday, June 13, 2022, the Gaia mission releases a new catalog, containing data for nearly two billion stars in our galaxy. 450 scientists from 20 countries are coordinating their efforts to process and make usable the billions of raw data collected on our galaxy by ESA’s Gaia satellite since its launch in 2013. France is the first contributor to the Gaia mission. Scientists from Paris Observatory - PSL participate very actively, with two key responsibilities in Gaia DR3 : the processing and analysis of Gaia’s spectrograph data and those of the star systems (double or multiple).
Gaia is ESA’s mission to create the most accurate and complete multi-dimensional map of the Milky Way. This allows astronomers to reconstruct our home galaxy’s structure and past evolution over billions of years, and to better understand the lifecycle of stars and our place in the Universe.
What’s new in data release 3 ?
Gaia’s data release 3 contains new and improved details for almost two billion stars in our galaxy. The catalogue includes new information including chemical compositions, stellar temperatures, colours, masses, ages, and the speed at which stars move towards or away from us (radial velocity). Much of this information was revealed by the newly released spectroscopy data, a technique in which the starlight is split into its constituent colours (like a rainbow). The data also includes special subsets of stars, like those that change brightness over time.
Also new in this data set is the largest catalogue yet of binary stars, thousands of Solar System objects such as asteroids and moons of planets, and millions of galaxies and quasars outside the Milky Way.
Gaia data release 3 : exploring our multi-dimensional Milky Way
Images
La Voie lactée de Gaia en mouvement
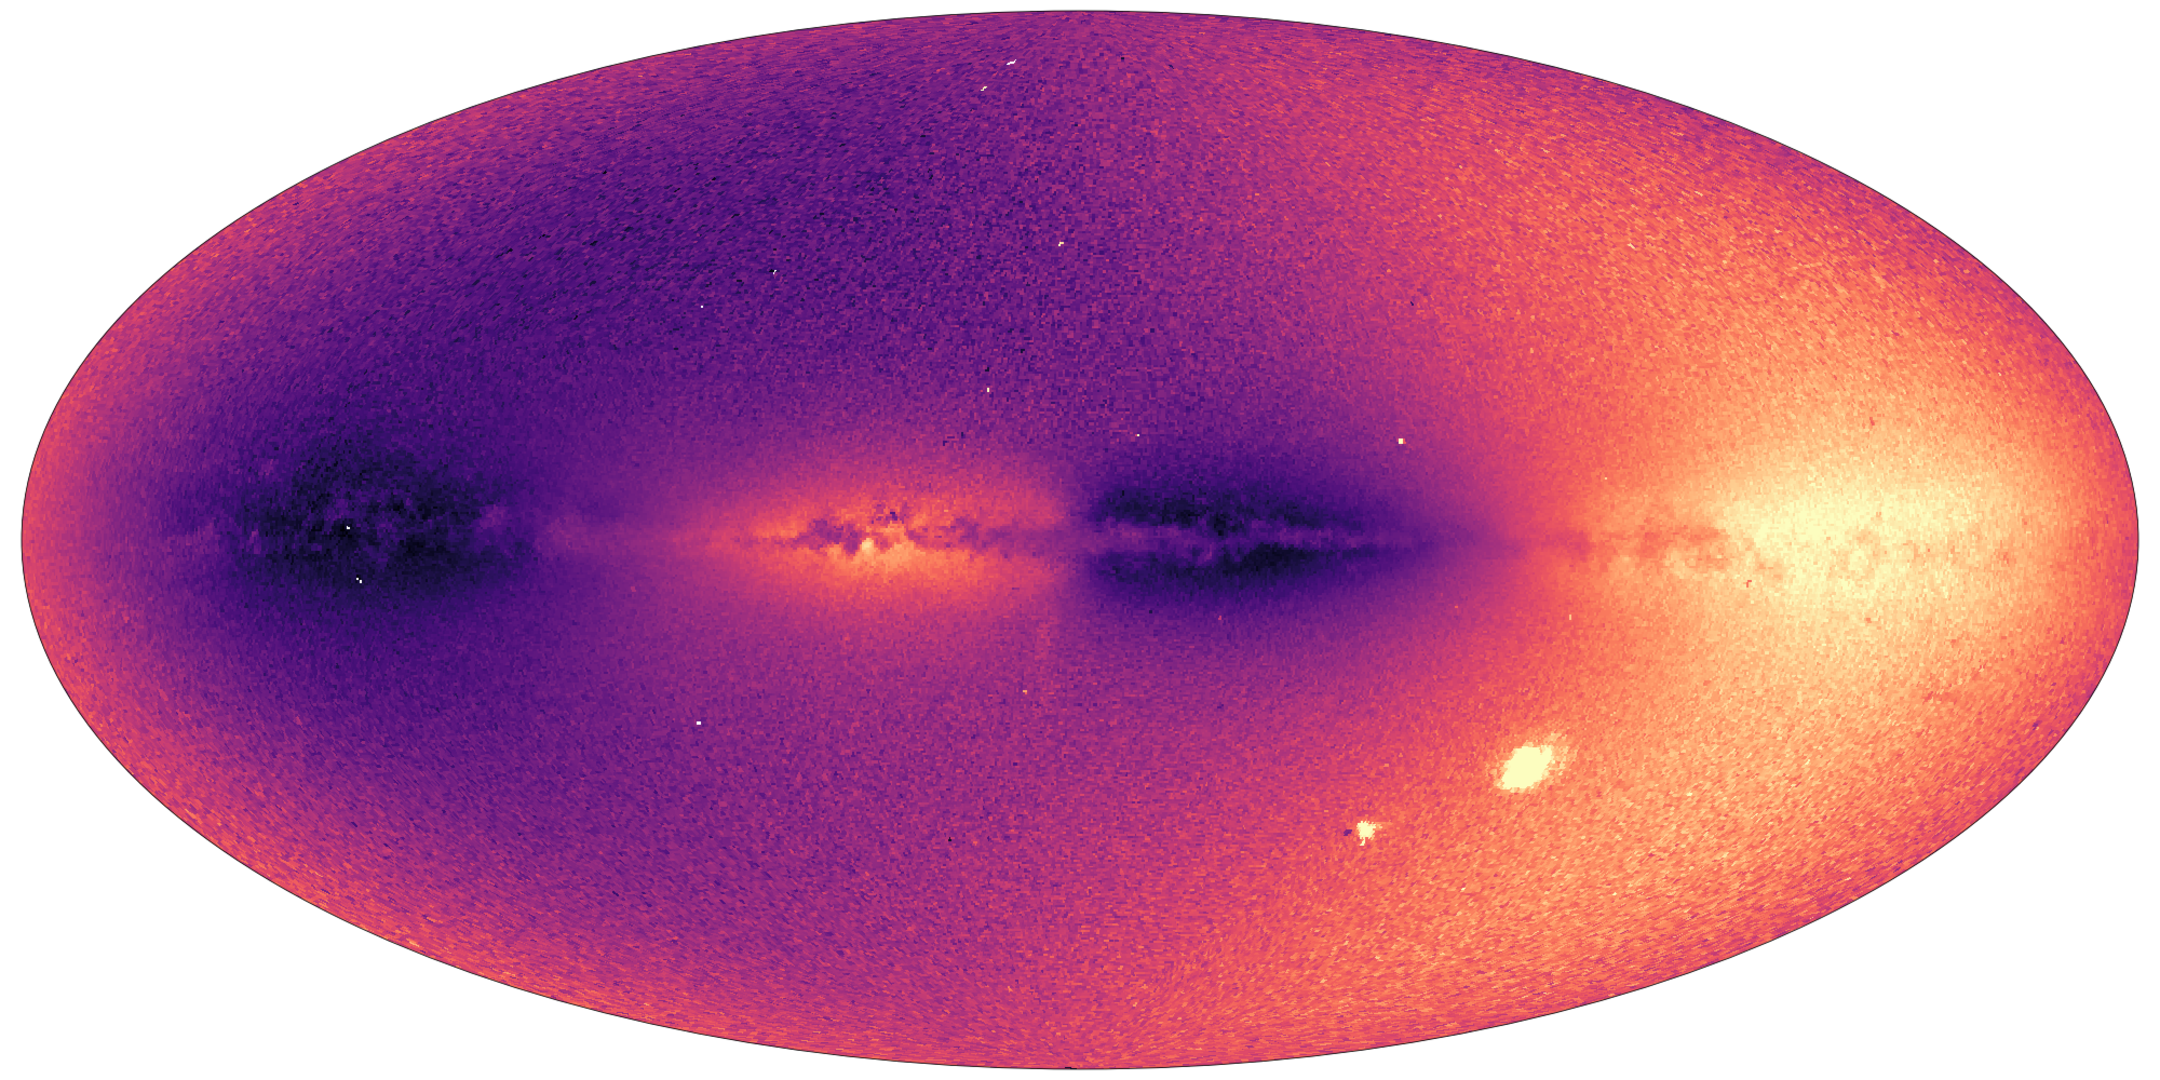
La version 3 des données Gaia de l’ESA nous montre la vitesse à laquelle plus de 30 millions d’objets de la Voie lactée (principalement des étoiles) se rapprochent ou s’éloignent de nous. C’est ce qu’on appelle la "vitesse radiale". Nous pouvons maintenant voir comment les objets se déplacent sur une grande partie du disque de la Voie lactée.
La rotation du disque, projetée le long de la ligne de visée, est visible par l’alternance de zones claires (s’éloignant de nous) et de zones sombres (se rapprochant de nous). Plusieurs objets dont la vitesse radiale diffère de celle de leur environnement proche sont visibles par contraste.
Les Grands et Petits Nuages de Magellan (LMC et SMC) apparaissent comme des points lumineux dans le coin inférieur droit de l’image. La galaxie naine du Sagittaire est visible comme une faible bande quasi-verticale sous le Centre Galactique.
Plusieurs amas globulaires apparaissent comme de minuscules points dans l’image, tels que 47 Tucanae, le point sombre situé immédiatement à gauche du SMC.
La troisième version des données Gaia de l’ESA nous montre la vitesse à laquelle plus de 30 millions d’étoiles de la Voie lactée se rapprochent ou s’éloignent de nous. C’est ce qu’on appelle la "vitesse radiale", qui constitue la troisième dimension de la vitesse dans la carte Gaia de notre galaxie. Avec les mouvements propres des étoiles (mouvement dans le ciel), nous pouvons maintenant voir comment les étoiles se déplacent sur une grande partie de la Voie lactée.
Cette carte du ciel montre le champ de vitesse de la Voie lactée pour 26 millions d’étoiles. Les couleurs montrent les vitesses radiales des étoiles le long de la ligne de visée. Le bleu montre les parties du ciel où le mouvement moyen des étoiles se rapproche de nous et le rouge montre les régions où le mouvement moyen s’éloigne de nous. Les lignes visibles sur la figure tracent le mouvement des étoiles projetées sur le ciel (mouvement propre). Ces lignes montrent comment la direction de la vitesse des étoiles varie selon la latitude et la longitude galactiques. Les Grands et Petits Nuages de Magellan (LMC et SMC) ne sont pas visibles car seules les étoiles ayant des distances bien définies ont été sélectionnées pour réaliser cette image.
Carte Gaia de la poussière interstellaire dans la Voie lactée
La mission Gaia de l’ESA ne se contente pas de cartographier les étoiles de notre galaxie, elle nous dit aussi ce qui se trouve entre les étoiles. L’espace entre les étoiles n’est pas vide, mais rempli de nuages de poussière et de gaz, d’où naissent les étoiles.
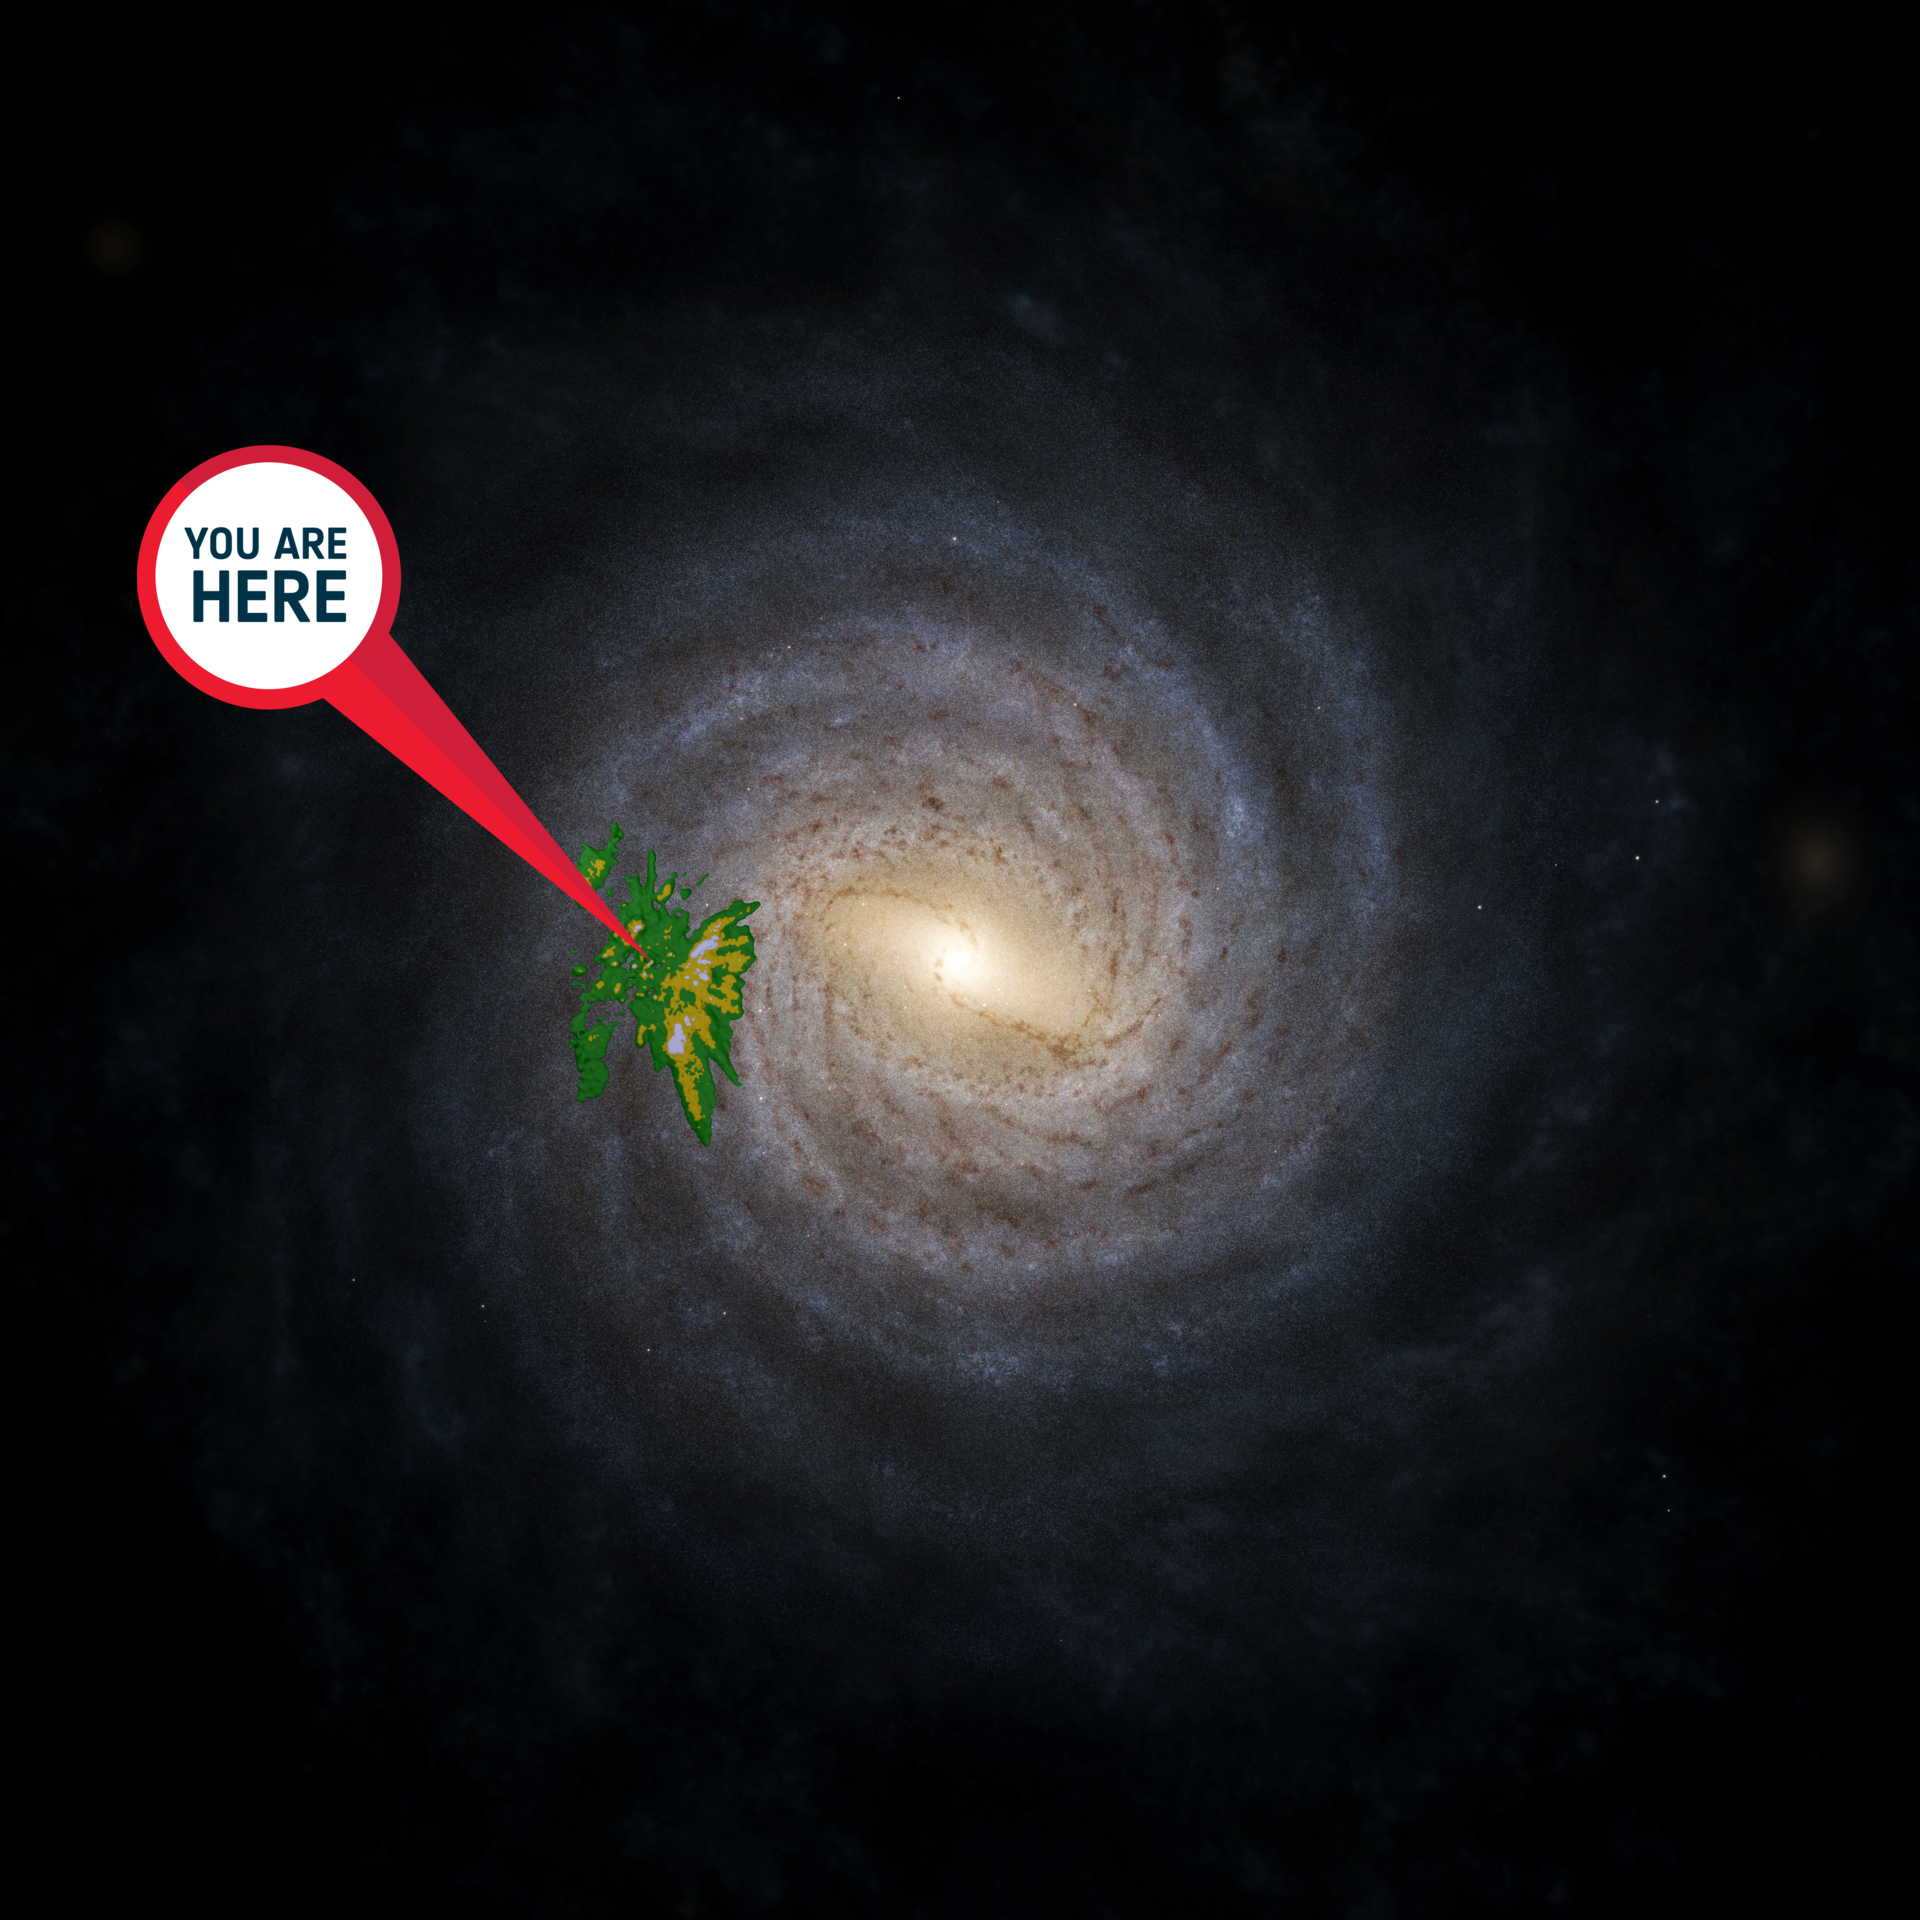
La composition des étoiles peut nous renseigner sur leur lieu de naissance et leur parcours ultérieur, et donc sur l’histoire de la Voie lactée. Avec la publication des données d’aujourd’hui, Gaia nous apporte une carte chimique de la galaxie.
Cette image montre une impression artistique de la Voie lactée, et par-dessus, une superposition montrant l’emplacement et les densités d’un échantillon de jeunes étoiles provenant de la version 3 des données de Gaia (en jaune-vert). Le signe "vous êtes ici" pointe vers le Soleil.
Cette image montre les orbites de plus de 150 000 astéroïdes dans la version 3 des données de Gaia, depuis les parties internes du système solaire jusqu’aux astéroïdes troyens à la distance de Jupiter, avec différents codes de couleur. Le cercle jaune au centre représente le Soleil. Le bleu représente la partie intérieure du système solaire, où se trouvent les astéroïdes proches de la Terre, les traversées de Mars et les planètes terrestres. La ceinture principale, entre Mars et Jupiter, est verte. Les trojans de Jupiter sont rouges.
La position de chaque astéroïde à 12h00 CEST le 13 juin 2022 est tracée. Chaque segment de courbe montre le mouvement d’un astéroïde sur 10 jours. Les corps intérieurs se déplacent plus rapidement autour du Soleil (cercle jaune au centre). Le bleu représente la partie intérieure du système solaire, où se trouvent les astéroïdes proches de la Terre, les traversées de Mars et les planètes terrestres. La ceinture principale, entre Mars et Jupiter, est en vert. Les deux "nuages" orange correspondent aux astéroïdes troyens de Jupiter.