Lundi 13 juin 2022, la mission Gaia rend public un nouveau catalogue, contenant des données pour près de deux milliards d’étoiles dans notre galaxie. 450 scientifiques issus de 25 pays coordonnent leurs efforts pour traiter et rendre exploitables les milliards de données brutes recueillies sur notre galaxie par le satellite Gaia de l’ESA depuis son lancement en 2013. La France est le premier pays contributeur de la mission Gaia. Les scientifiques de l’Observatoire de Paris – PSL y participent très activement, avec deux responsabilités essentielles à Gaia DR3 : le traitement et l’analyse des données du spectrographe de Gaia et ceux des systèmes d’étoiles (doubles ou multiples).
Gaia est la mission de l’ESA visant à créer la carte multidimensionnelle la plus précise et la plus complète de la Voie lactée. Grace aux données collectées, les astronomes peuvent reconstituer la structure de notre galaxie à son origine et son évolution sur des milliards d’années. Ils parviennent à mieux comprendre le cycle de vie des étoiles et donc notre place dans l’Univers.
___________________
Vidéo de l’ESA : ◾ Exploration de notre Voie lactée multidimensionnelle
Dans cette vidéo, Frédéric Arenou et Paola Sartoretti, tous deux ingénieurs CNRS au laboratoire GEPI de l’Observatoire de Paris - PSL, présentent les apports du troisième catalogue de Gaia.
__________________
Quelles sont les nouveautés du troisième catalogue Gaia ?
La version 3 des données de Gaia contient des paramètres pour près de deux milliards d’étoiles dans notre galaxie.
Le catalogue comprend de nouvelles informations, notamment les compositions chimiques, les températures stellaires, les couleurs, les masses, les âges et la vitesse à laquelle les étoiles se rapprochent ou s’éloignent de nous (vitesse radiale).
La plupart de ces informations ont été révélées par les données de spectroscopie récemment publiées, une technique dans laquelle la lumière des étoiles est divisée en ses couleurs constitutives (comme un arc-en-ciel). Les données comprennent également des sous-ensembles spéciaux d’étoiles, comme celles qui changent de luminosité au fil du temps.
Parmi les autres nouveautés de cet ensemble de données figurent :
le plus grand catalogue d’étoiles binaires,
des milliers d’objets du système solaire tels que les astéroïdes et les lunes des planètes,
des millions de galaxies et de quasars en dehors de la Voie lactée.
Les astronomes décrivent d’étranges "tremblements d’étoiles", de l’ADN stellaire, des mouvements asymétriques et d’autres informations fascinantes dans cette étude de la Voie lactée la plus détaillée à ce jour.
Images
La Voie lactée de Gaia en mouvement
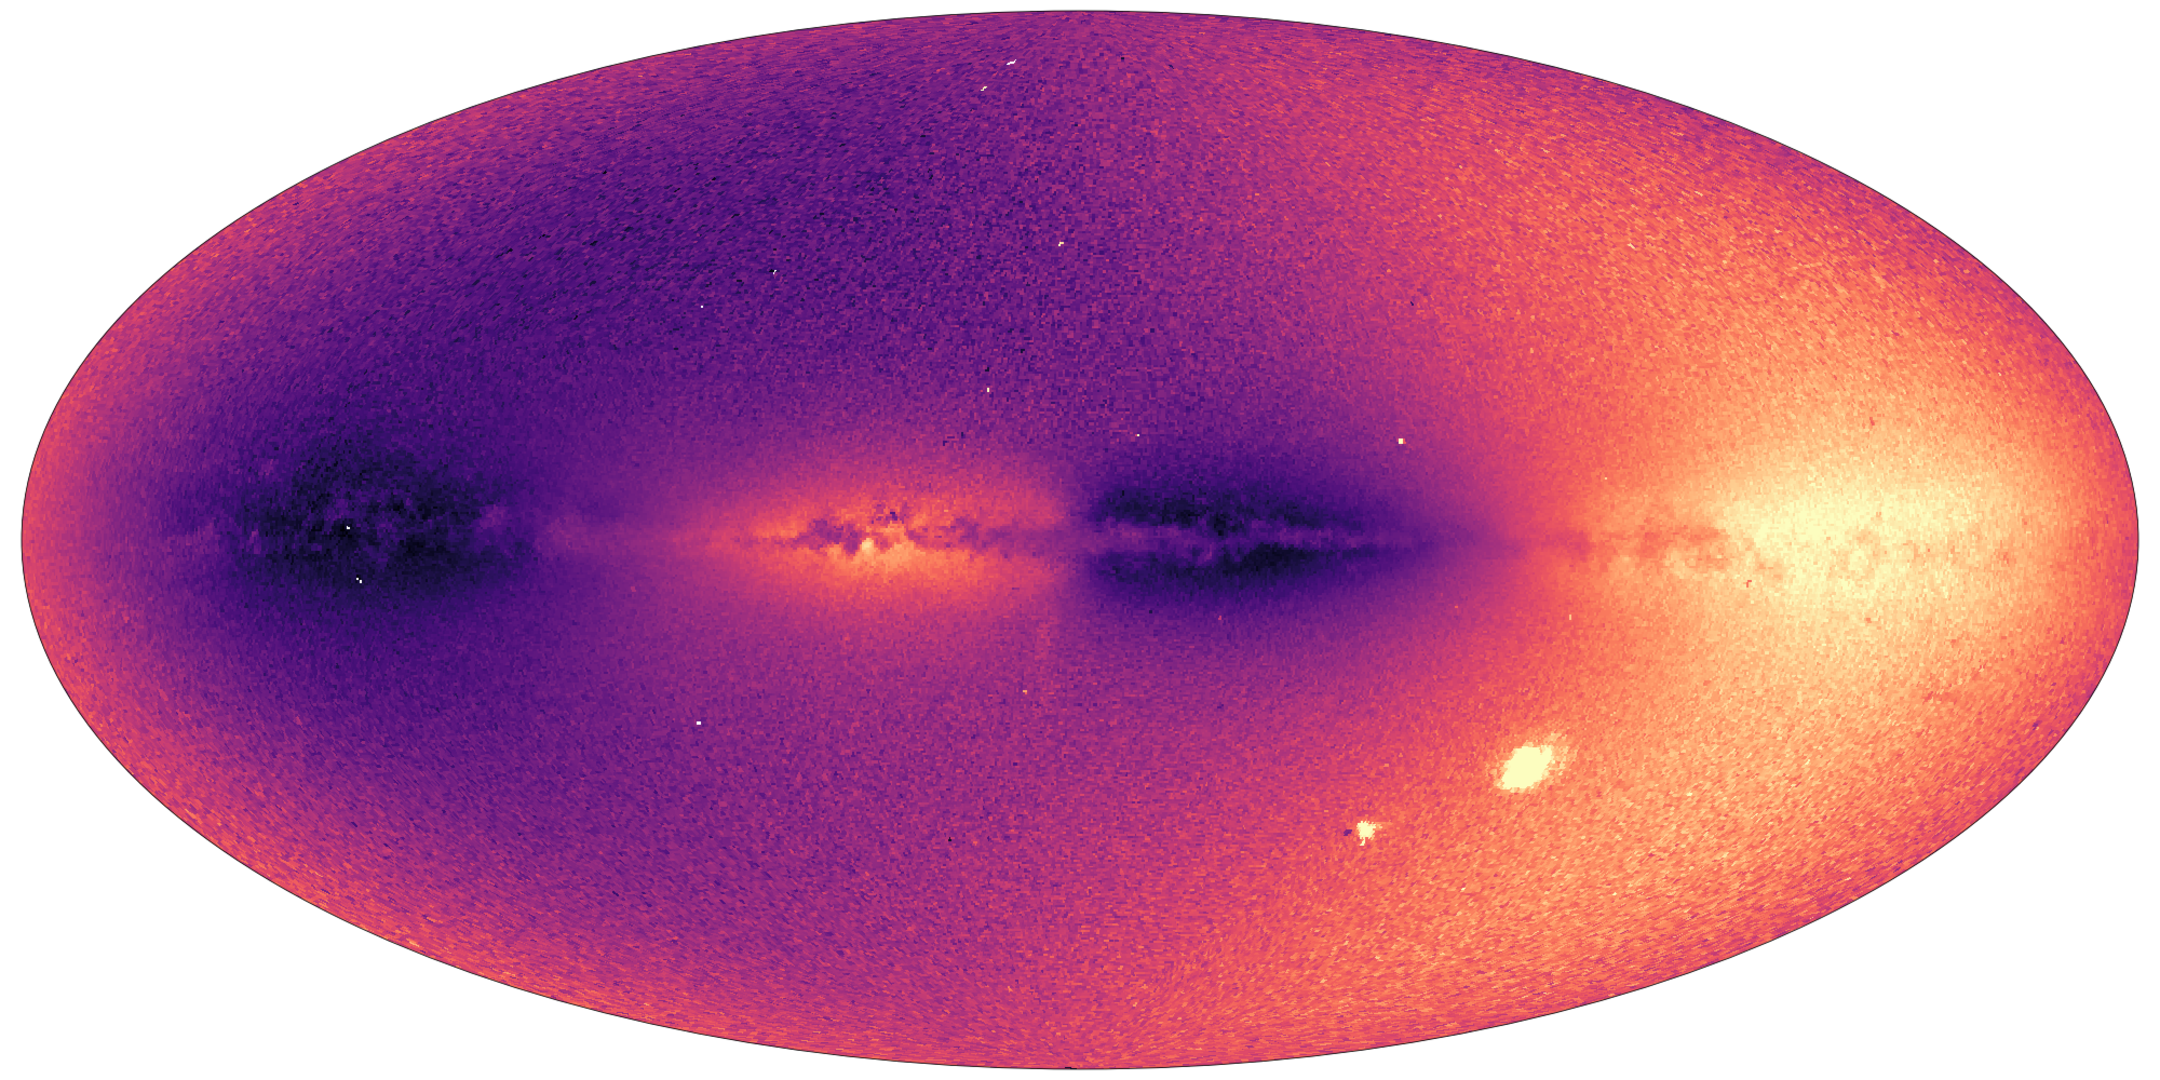
La version 3 des données Gaia de l’ESA nous montre la vitesse à laquelle plus de 30 millions d’objets de la Voie lactée (principalement des étoiles) se rapprochent ou s’éloignent de nous. C’est ce qu’on appelle la "vitesse radiale". Nous pouvons maintenant voir comment les objets se déplacent sur une grande partie du disque de la Voie lactée.
La rotation du disque, projetée le long de la ligne de visée, est visible par l’alternance de zones claires (s’éloignant de nous) et de zones sombres (se rapprochant de nous). Plusieurs objets dont la vitesse radiale diffère de celle de leur environnement proche sont visibles par contraste.
Les Grands et Petits Nuages de Magellan (LMC et SMC) apparaissent comme des points lumineux dans le coin inférieur droit de l’image. La galaxie naine du Sagittaire est visible comme une faible bande quasi-verticale sous le Centre Galactique.
Plusieurs amas globulaires apparaissent comme de minuscules points dans l’image, tels que 47 Tucanae, le point sombre situé immédiatement à gauche du SMC.
La troisième version des données Gaia de l’ESA nous montre la vitesse à laquelle plus de 30 millions d’étoiles de la Voie lactée se rapprochent ou s’éloignent de nous. C’est ce qu’on appelle la "vitesse radiale", qui constitue la troisième dimension de la vitesse dans la carte Gaia de notre galaxie. Avec les mouvements propres des étoiles (mouvement dans le ciel), nous pouvons maintenant voir comment les étoiles se déplacent sur une grande partie de la Voie lactée.
Cette carte du ciel montre le champ de vitesse de la Voie lactée pour 26 millions d’étoiles. Les couleurs montrent les vitesses radiales des étoiles le long de la ligne de visée. Le bleu montre les parties du ciel où le mouvement moyen des étoiles se rapproche de nous et le rouge montre les régions où le mouvement moyen s’éloigne de nous. Les lignes visibles sur la figure tracent le mouvement des étoiles projetées sur le ciel (mouvement propre). Ces lignes montrent comment la direction de la vitesse des étoiles varie selon la latitude et la longitude galactiques. Les Grands et Petits Nuages de Magellan (LMC et SMC) ne sont pas visibles car seules les étoiles ayant des distances bien définies ont été sélectionnées pour réaliser cette image.
Carte Gaia de la poussière interstellaire dans la Voie lactée
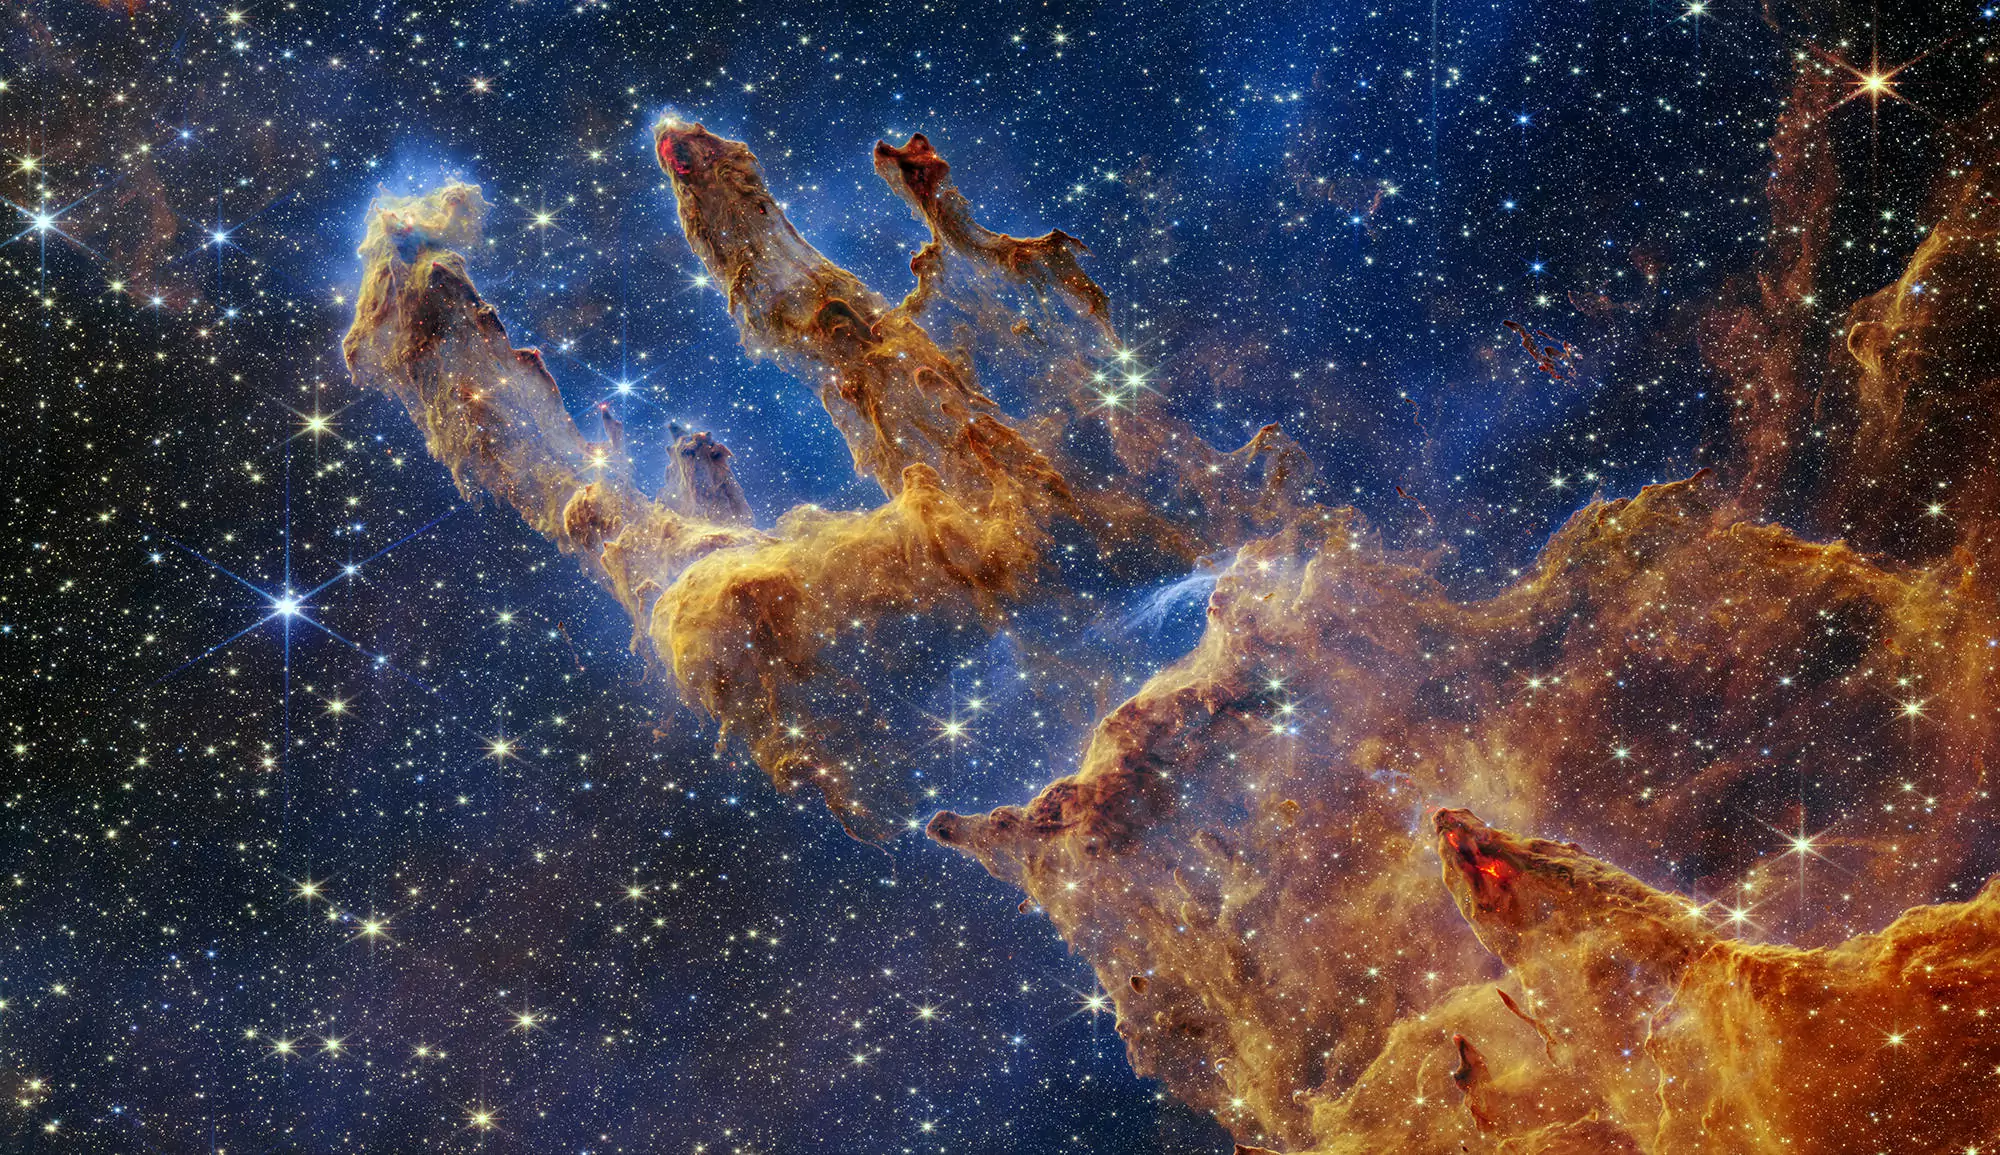
La mission Gaia de l’ESA ne se contente pas de cartographier les étoiles de notre galaxie, elle nous dit aussi ce qui se trouve entre les étoiles. L’espace entre les étoiles n’est pas vide, mais rempli de nuages de poussière et de gaz, d’où naissent les étoiles.
La composition des étoiles peut nous renseigner sur leur lieu de naissance et leur parcours ultérieur, et donc sur l’histoire de la Voie lactée. Avec la publication des données d’aujourd’hui, Gaia nous apporte une carte chimique de la galaxie.
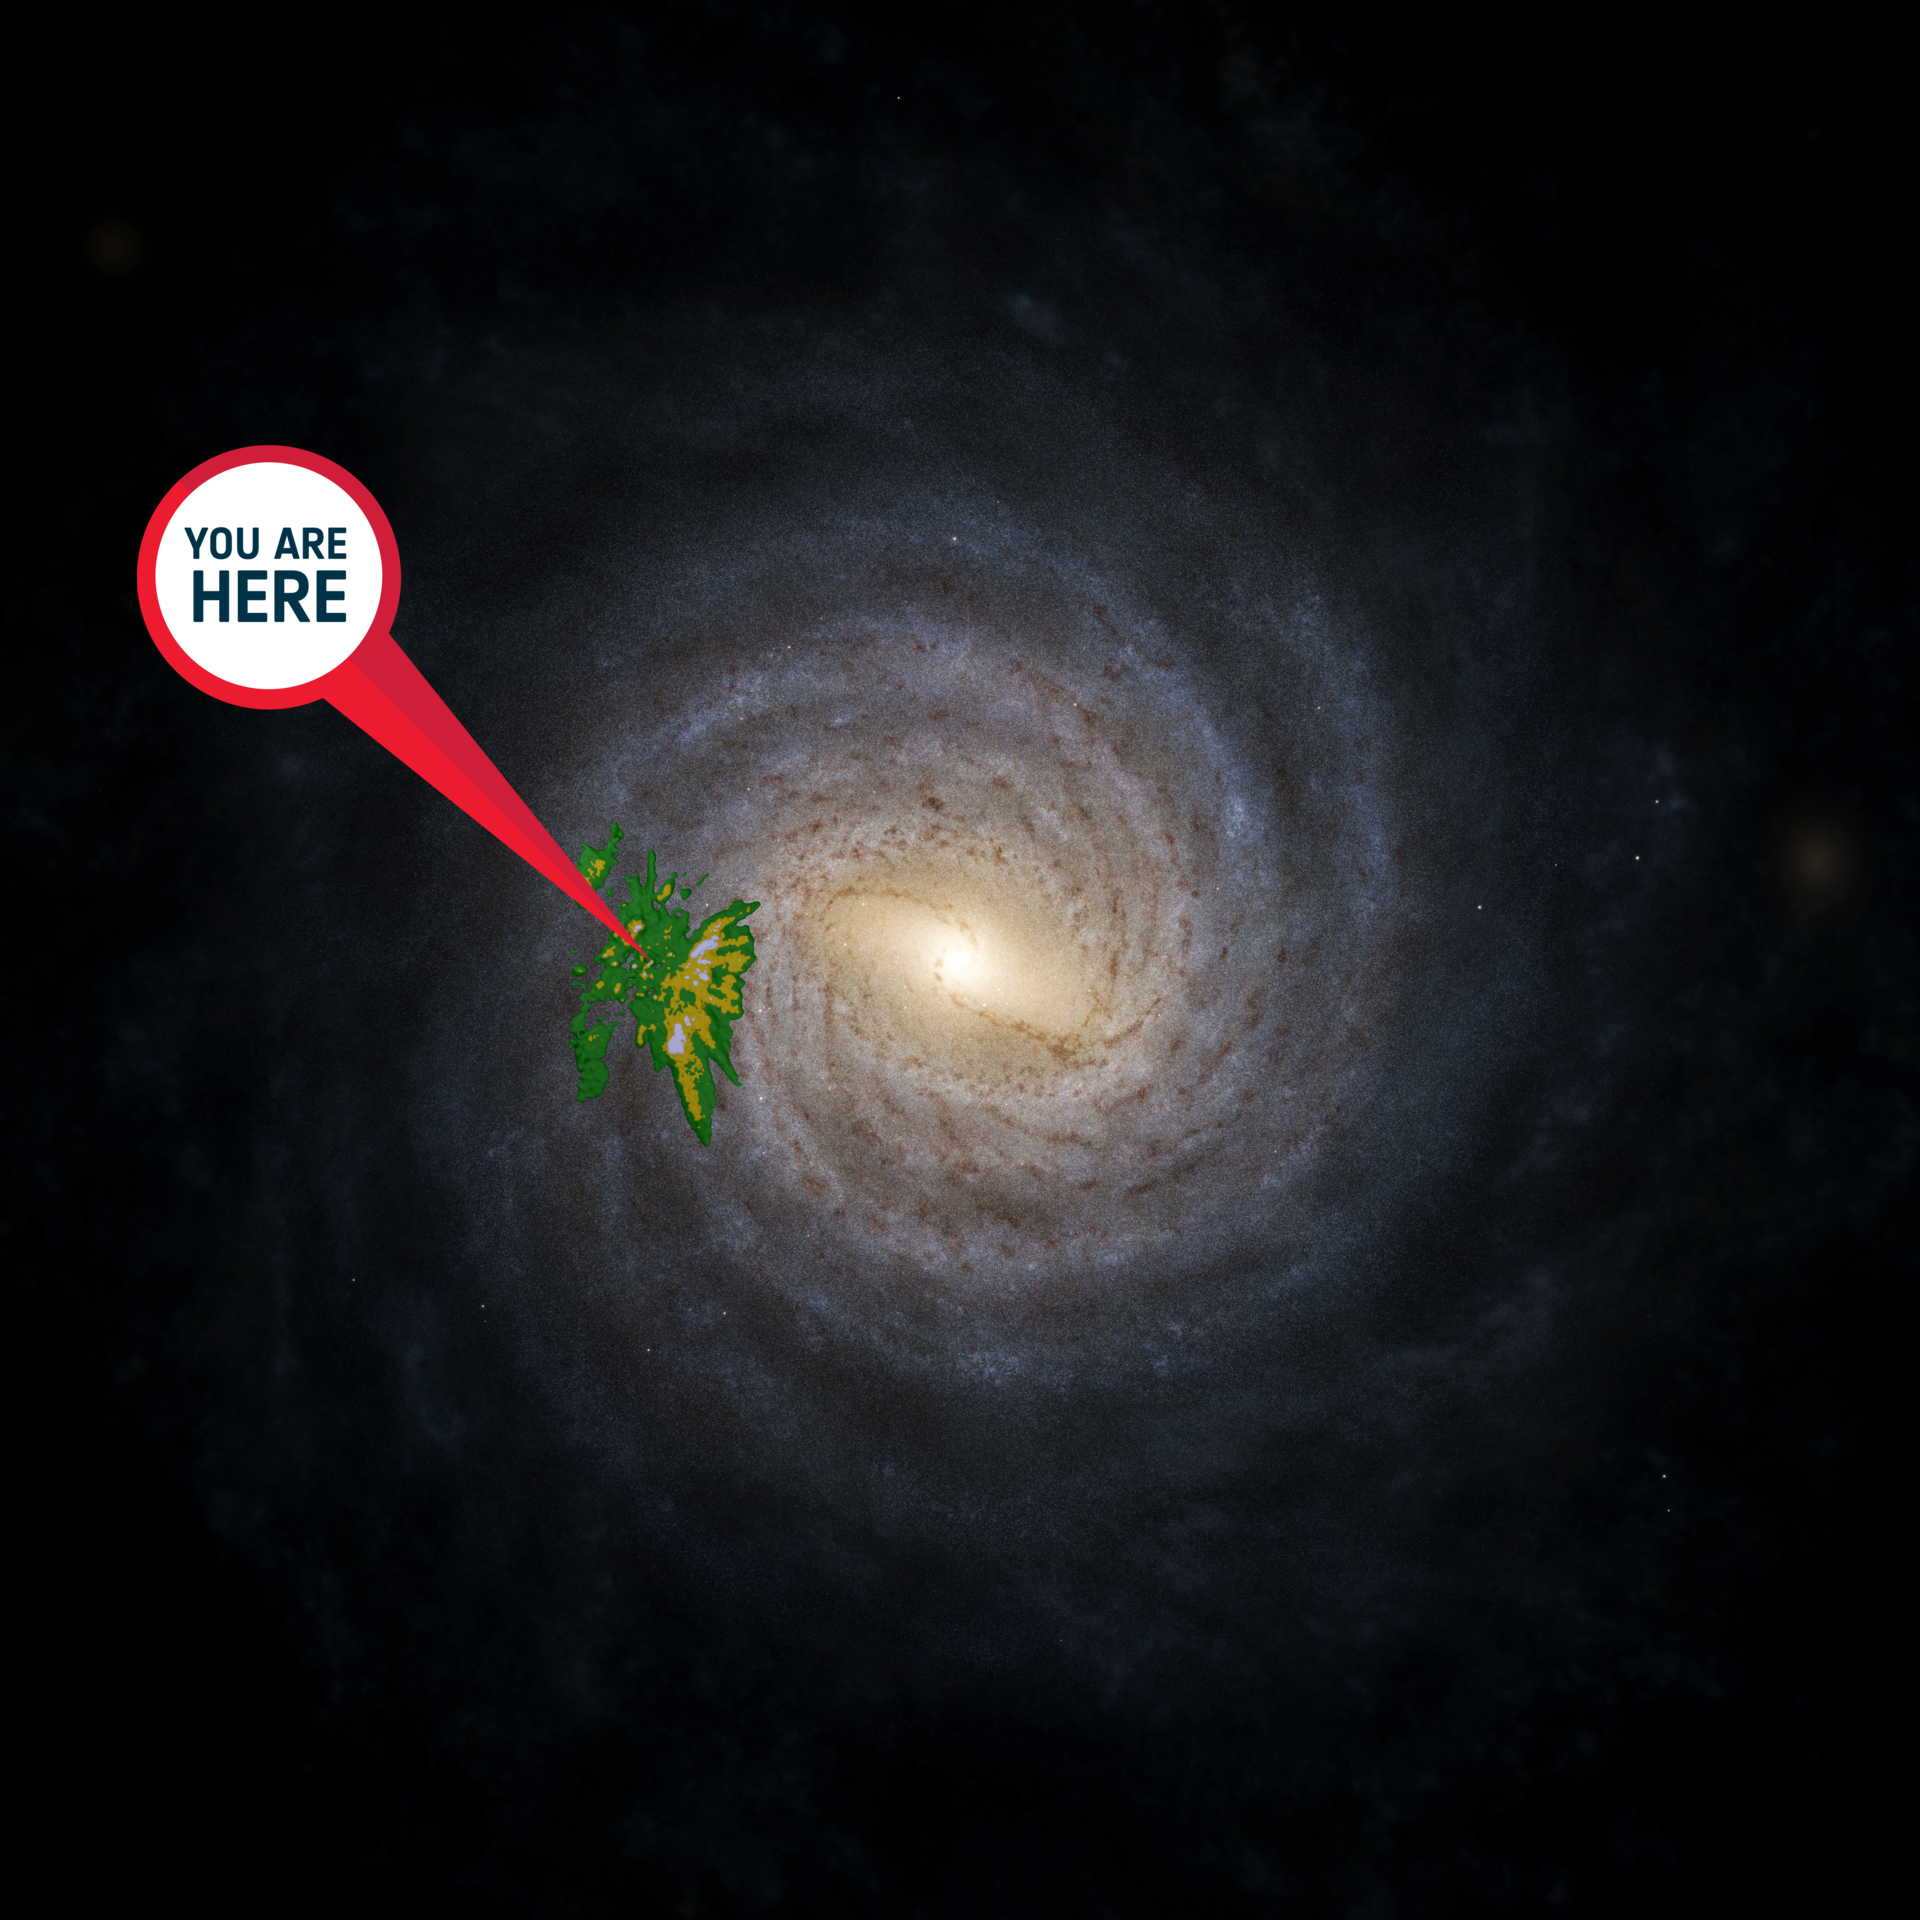
Cette image montre une impression artistique de la Voie lactée, et par-dessus, une superposition montrant l’emplacement et les densités d’un échantillon de jeunes étoiles provenant de la version 3 des données de Gaia (en jaune-vert). Le signe "vous êtes ici" pointe vers le Soleil.
Cette image montre les orbites de plus de 150 000 astéroïdes dans la version 3 des données de Gaia, depuis les parties internes du système solaire jusqu’aux astéroïdes troyens à la distance de Jupiter, avec différents codes de couleur. Le cercle jaune au centre représente le Soleil. Le bleu représente la partie intérieure du système solaire, où se trouvent les astéroïdes proches de la Terre, les traversées de Mars et les planètes terrestres. La ceinture principale, entre Mars et Jupiter, est verte. Les trojans de Jupiter sont rouges.
La position de chaque astéroïde à 12h00 CEST le 13 juin 2022 est tracée. Chaque segment de courbe montre le mouvement d’un astéroïde sur 10 jours. Les corps intérieurs se déplacent plus rapidement autour du Soleil (cercle jaune au centre). Le bleu représente la partie intérieure du système solaire, où se trouvent les astéroïdes proches de la Terre, les traversées de Mars et les planètes terrestres. La ceinture principale, entre Mars et Jupiter, est en vert. Les deux "nuages" orange correspondent aux astéroïdes troyens de Jupiter.