Planet Venus, permanently covered with a thick cloud deck of sulfuric acid, exhibits a complex atmospheric circulation and strong photochemical activity, with processes — like the sulfur cycle - which are not fully understood presently. Since 2006, the Venus Express spacecraft, in orbit around the planet, monitors its atmosphere, its circulation and photochemistry in order to bring answers to these questions. In parallel, ground-based observations of the Venus disk, at specific wavelengths characteristic of various atmospheric species, can bring complementary information.

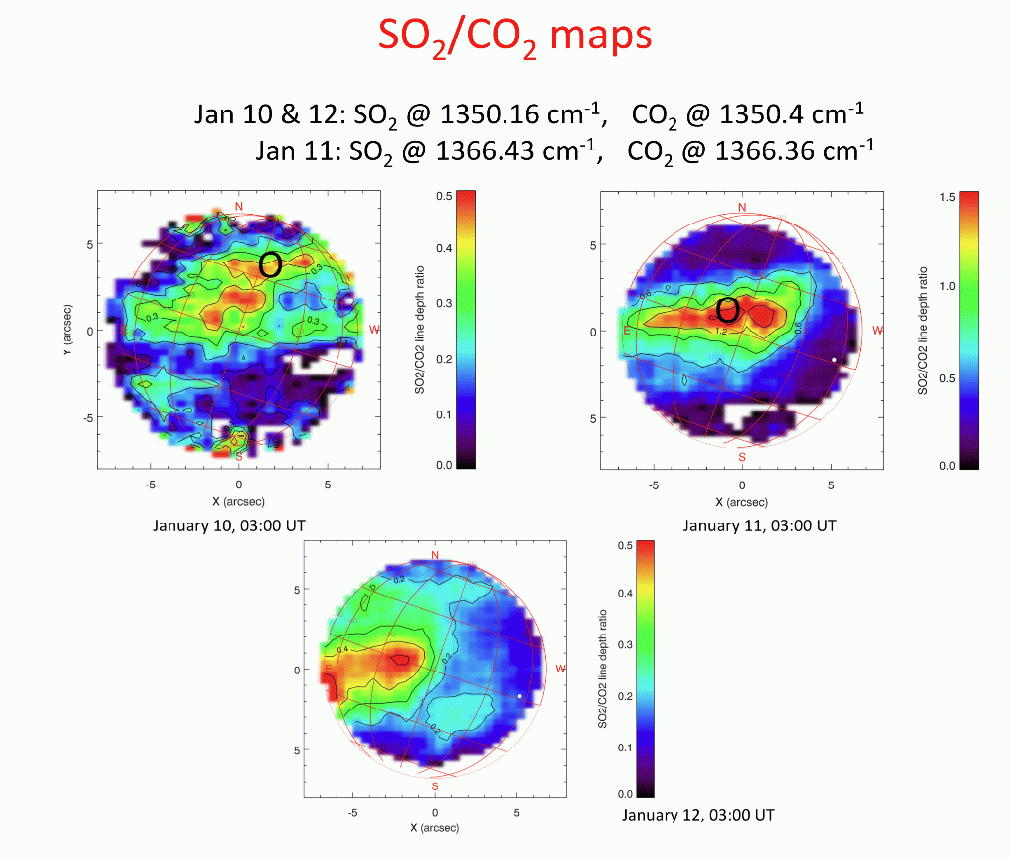
In January 2012, infrared observations of Venus were recorded with the TEXES imaging spectrometer (Texas Echelon cross-Echelle Spectrograph) at the NASA IRTF (InfraRed Telescope Facility) at Mauna Kea Observatory (Hawaii). The spectra recorded at 7.3-7.4 mm with a resolving power of 80000 probe the atmosphere of Venus at the level of the cloudtop. Maps of the water vapor abundance (measured through its proxy HDO) and the sulfur dioxyde SO2 have been measured during three successive nights. The abundances are measured from the line depth ratio of HDO and SO2 versus CO2, the major atmospheric component. H2O and SO2 are the two key elements involved in the condensation and saturation of the sulfuric acid present in the clouds. Surprisingly, the maps of the two components show spectacular differences. While the H2O map (Fig. 1), globally uniform, shows little variation on a timescale of 48 hours, the SO2 map (Fig. 2) shows local variations up to a factor 10 and very strong temporal variations on a timescale of 24 hours. These variations cannot be due to dynamical motions as they would imply very fast winds at the cloud level, not compatible with the wind speeds measured by Venus Express. More likely, the SO2 variations are due to the very short photochemical lifetime of sulfur dioxyde. Below the clouds, the atmosphere of Venus is strongly convective. Small SO2 convective cells, formed at the cloud level, could disappear in less than a day and be responsible for the observed maps.

