The latest 21-cm maps of M 31, one of the two most massive spirals in the Local Group with the Milky Way, had been done in the early 1980’s. The DRAO synthesis telescope (Canada) has been used in 2005 and has allowed the detection of neutral hydrogen (or HI gas) up to a galactocentric radius of 38 kpc (118000 light-years). As of date, it is the most extended observation of the HI disc of M 31.
These observations have first allowed the detection of many HI emission peaks in the vast majority of the field-of-view, sometimes with up to five different velocity components (Figure 1). This rare phenomenon suggests that the gaseous distribution of M 31 is more complex than previously thought. This could be due to e.g. a warped disc, or to the presence of a halo of diffuse gas that would embed the M 31 disc or even tidal features.

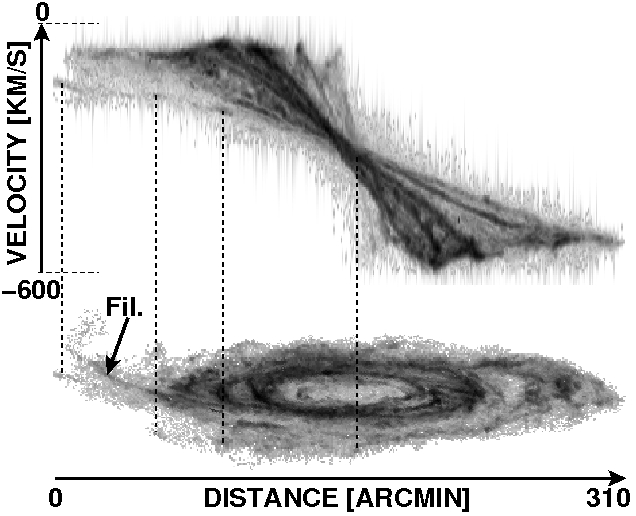
Then, from the analysis of the HI datacube (Figure 2) it has been discovered a new HI structure in the disc outskirts. It is a very diffuse, extended (32 kpc long in projection onto the sky plane) and low mass (108 solar masses) structure. It has no counterpart in the opposite side of the disc and looks like a tidal spiral arm. One also notices a very thin and filamentary extension at the disc end (shown by the letters "Fil." on Figure 2). The analysis of its kinematics reveals outflowing gas motions, or noncircular motions. Here again it could be the signature of a tidal interaction with another galaxy.
Furthermore, the analysis of the velocity field (Figure 3, left) has allowed to quantify two variations of the inclination of the M 31 plane: the central parts of the disc (R < 6 kpc) are less inclined than the average, while the disc outskirts (R > 27 kpc) appear more inclined. These warps likely result from tidal interactions with neighbouring galaxies. A collision with the dwarf elliptical Messier 32 could explain the central warp, and an interaction with another dwarf galaxy, NGC 205, could explain the outer warp.
Finally, it is shown for the first time that the rotation velocity of the M 31 disc increases in its outer regions, from R = 30 kpc (Figure 3, right). Previous less extended and less accurate measurements had shown that the velocity seemed to be constant at large radius, which is not verified any more.
The analysis of the dynamics of M 31 from the rotation curve shows that the dark matter component is four times more massive than the baryonic matter (stars, atomic and molecular gas, central supermassif black hole). The M 31 mass derived at the last data point of the rotation curve (R=38 kpc) is M 5×10¹¹ solar masses. Its total mass (the one extrapolated at the virial radius of the dark matter halo) is Mtot 1012 solar masses. The Andromeda galaxy and the Milky Way seem to have an identical total mass!